Visual Studio Professional 2013 Update 3

Visual Studio 2013 Issues

I’m using Visual Studio 2013 Professional, and I love it. I’m getting deep into WPF & XAML, and it’s a great IDE for development in that area. For reference, here’s the version info from the ‘About’ window.

Visual Studio Professional 2013 Version 12.0.30723.00 Update 3

However, I’m having a number of issues. I have detailed these below.


Issue 1:The object invoked has disconnected from its clients

Occasionally, when attempting to start debugging, I get the following error:

The Object Invoked
Error while trying to run project: Unable to start debugging. The object invoked has disconnected from its clients.

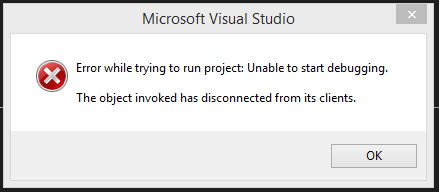
Odd. Start debugging again, and most of the time it will start without issue.

I’ve opened a bug report on Microsoft Connect: https://connect.microsoft.com/VisualStudio/feedbackdetail/view/982277/the-object-invoked-has-disconnected-from-its-clients


Issue 2: The Stub Manager…

Occasionally, also when starting debugging, I get the following error. Sometimes the error mentioned above in Issue 1 appears alongside, sometimes not:

The object has been run down by the stub manager while there are external clients.

Again, if I restart debugging for the application usually it will start without a hitch.

I’ve opened a bug report on Microsoft Connect: https://connect.microsoft.com/VisualStudio/feedbackdetail/view/982281/the-object-has-been-run-down-by-the-stub-manager-while-there-are-external-clients

Issue 3: Intellisense

Occasionally (I see a trend beginning to emerge here), Intellisense doesn’t sense. I have to type at least 2 characters of the Method, or Property or whatever, then delete one character. At this point, the matching member will appear.

This issue only appears occasionally – I’ve just tested it again to get a screenshot and of course, Intellisense worked fine.


Issue 4: There were (not) Build Errors.

Occasionally (definite trend established!), and this one is the most frustrating of the lot, Visual Studio 2013 will tell me that it can’t build the solution as there were errors. Except there are not. There’s nothing in the ‘Error List’, not even a warning.

There were (not) build errors.

Based on various forum suggestions I’ve tried ‘Run as Administrator’, and I’ve tried deleting the .suo user settings file. I have also tried also deleting the bin folder in the Solution folder but to no avail.  Another suggestion was to turn on detailed output in Options -> Projects and Solutions -> Build and Run. This didn’t reveal anything. The only thing that works is restarting Visual Studio.

Here’s my Connect bug report: https://connect.microsoft.com/VisualStudio/feedbackdetail/view/982296/there-were-build-errors-when-building-a-solution-project


Help!

I won’t say that the above issues are ruining my experience with VS2013 Update 3, but they are little niggles that need to be ironed out. Also, I should mention that I wasn’t having any of the above issues with Update 2, however I was using that on Windows 8, not 8.1 which I am now using.

If anyone can shed any light on the above problems, then please let me know in the comments.

Swyx D-Channel Monitor Logfile Location

Hunting down the mystery missing log file in the Swyx D-Channel Monitor.

I had some issues trying to find the log file that the Swyx D-Channel Monitor (v8.00) creates when running on Windows Server 2003.

According to the Swyx KB Article, it can be found in the same place as the executable i.e. C:\Program Files\Swyx ISDN Tools, in the ‘Log’ folder. In my instance, it was not. Using the incredibly useful Procmon, I found that the file was actually created in the following path:

C:\Documents and Settings\All Users\Application Data\Swyx\Traces\

Swyx D-Channel Monitor

The filename of the file itself can be found at the bottom of the Swyx D-Channel Monitor window.

I originally wanted to create an executable to scan this file so that I could get alerts if a L1 deactivated message appears, however it would appear than the Swyx D-Channel Monitor locks the file for reading. I suppose I could handle startup & shutdown of the app using Process.Start (.NET) but that’s a bit more effort than I wanted to go to.


CPU Temperature Issues: i7 4970K

The problem:

My brand new development box (and render target), using a Gigabyte GA-Z97X-UD5H motherboard & Intel i7 4790K processor was showing a strange (read: high) CPU temperature as soon as the processor ramped up to 100%.

GA-Z97X-UD5H
The GA-Z97X-UD5H motherboard. Yup, it looks pretty much like other motherboards, with the exception of those lovely gold heatsinks.

When running Prime95, the Corsair Link software (and I backed the following readings up with Speedfan too) was reporting an instant increase to 80 degrees C when using the Blend setting, and a CPU temperature of 100 degrees C when using the Small FFTs (maximum heat) setting. This scared me somewhat! Especially as I was using the Corsair H110i Liquid Cooler – my first time with liquid cooling and at first I thought I’d done something wrong. Like plugged the pump motor into the wrong CPU header. I didn’t do that. No, really I didn’t :-). However…

And the solution:

If you’re running into the same issue, then I’m happy to say that a BIOS upgrade (from F4 to F8) sorted the issue out. CPU temperatures are now reporting at around 26 degrees C @ idle (which is only around 0.5 degree above ambient in our office…) and 65 degrees C when maxing the CPU out using the Blend setting in Prime95. I’m guessing the problem was just a reporting error, rather than the case of the actual CPU temperature hitting 80/100 degrees, but that is a guess.

Incidentally, it’s the first time I’ve used the BIOS on a MB as new as this one, and I gotta say its a dream to use. Mouse & network support, plus plenty of configuration options and a very quick BIOS flash procedure. I like.